About:
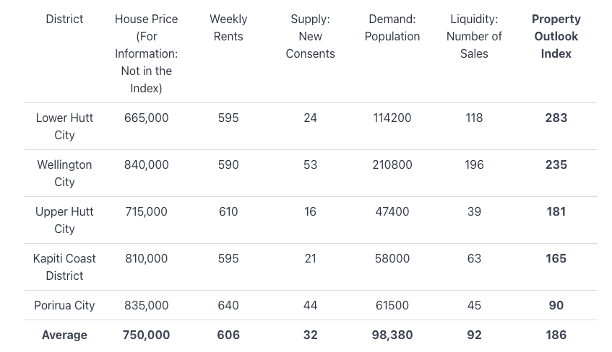
The introduction of the Property Outlook Index (POI) provides a step‑change in how the region is assessed, separating short‑term price performance from the deeper fundamentals that actually drive market strength.
The index makes clear that strong prices alone don’t guarantee a strong outlook—this comes from population, liquidity (number of sales), rents, and supply pressure, not just recent price shifts.
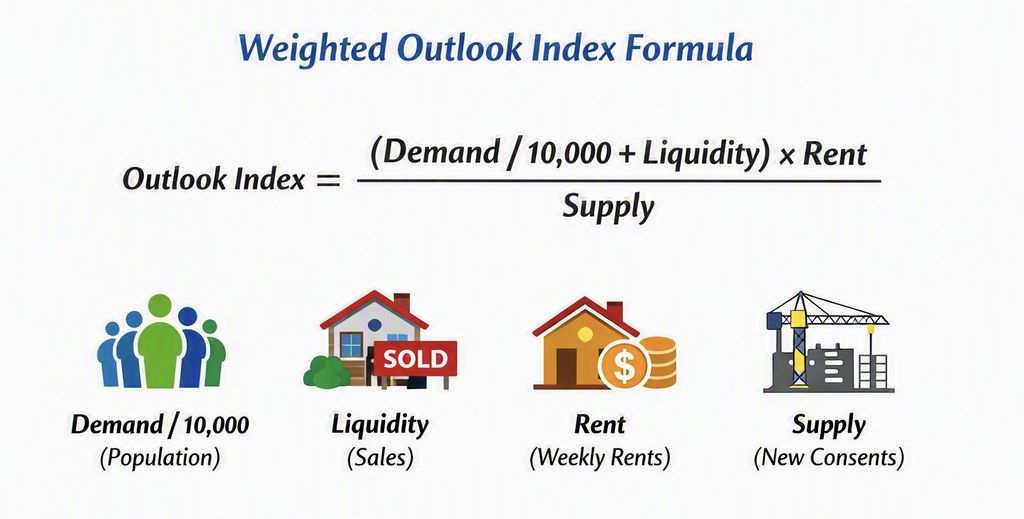
How to read the Index:
• Demand (population) pushes the index up
• Liquidity (number of sales) pushes the index up
• Rent (weekly rents) pushes the index up
• Supply (new consents) pushes the index down
This matches how people intuitively think about the market:
More buyers + more sales + higher rents + limited new building = stronger outlook.
Current Outlook (For Wellington, New Zealand):
Current Index – at July 2026